


Monthly Archives: August 2026
Mastering Brand Consistency Across All Touchpoints: A Practical Blueprint
Source:https://digital-iconic.com
A few years ago, I ordered a premium product from a direct-to-consumer brand whose sleek Instagram ads and polished website had completely won me over. Their digital presence screamed cutting-edge luxury and minimalist sophistication.
However, when the package arrived at my door, the experience unraveled in seconds. The outer box was flimsy and taped together haphazardly, the enclosed thank-you card featured a completely different font and logo variant, and a automated follow-up email sounded like it was written by a cold, corporate law firm.
The disconnect was jarring. In less than two minutes, the premium perception they had spent thousands of dollars building vanished into thin air.
In my ten years of consulting for emerging ventures and enterprise brands, I have seen this operational gap cost companies millions in customer lifetime value (LTV). Many business leaders think branding is simply picking a color palette and designing a catchy logo.
In reality, building true brand equity requires seamless execution across every physical, digital, and human interaction. Here are actionable brand consistency tips and strategic frameworks to align every customer touchpoint and turn casual buyers into lifelong brand advocates.
The Orchestra Analogy: Why Multichannel Alignment Matters
Think of your brand touchpoints like musicians in a symphony orchestra. Your website is the lead violin, your social media accounts are the woodwinds, customer support is the cello section, and your product packaging is the percussion.
+-------------------------------------------------------------+
|                     DISCONNECTED BRAND                      |
|  - Conflicting visual assets & rogue typography             |
|  - Jarring tone shifts between sales & support              |
|  - Eroded consumer trust & lower brand recall              |
+-------------------------------------------------------------+
                              ||
                              \/
+-------------------------------------------------------------+
|                     SYMPHONIC BRANDING                      |
|  - Unified design systems & centralized brand hub           |
|  - Cohesive brand voice across all communication channels   |
|  - Higher customer lifetime value (LTV) & brand equity      |
+-------------------------------------------------------------+
If the violin plays a classical piece while the percussion section plays heavy metal, the output isn’t creative variation—it is insufferable noise.
Mastering brand consistency tips isn’t about enforcing rigid corporate monotony. It is about conducting every department so that regardless of where a customer interacts with your company, the underlying melody remains unmistakably yours.
The Business Case for Uniform Touchpoint Execution
Brand cohesion isn’t just an aesthetic preference for designers—it is a core growth driver that impacts your financial metrics. Research consistently demonstrates that presenting a unified brand identity across all channels can increase revenue by upwards of 20%.
When a customer experiences conflicting messaging or visual identity across touchpoints, their brain registers cognitive friction. Subconsciously, they begin to question your operational reliability, attention to detail, and product quality.
Consistency breeds familiarity, familiarity builds psychological safety, and psychological safety drives repeat purchases and lower customer acquisition costs (CAC).
4 Strategic Pillars for Maintaining Multi-Touchpoint Harmony
Over a decade of auditing brand operations, I have learned that sustainable brand coherence rests on four foundational pillars:
                  +-----------------------------------+
                  | 1. Dynamic Brand Guidelines       |
                  +-----------------------------------+
                                    |
                                    v
                  +-----------------------------------+
                  | 2. Centralized Asset Management   |
                  +-----------------------------------+
                                    |
                                    v
                  +-----------------------------------+
                  | 3. Cross-Departmental Alignment   |
                  +-----------------------------------+
                                    |
                                    v
                  +-----------------------------------+
                  | 4. Regular Touchpoint Audits      |
                  +-----------------------------------+
Pillar 1: Dynamic Brand Guidelines and Design Systems
Static 100-page PDF brand manuals from five years ago belong in a museum. Modern organizations build dynamic, cloud-based design systems that house responsive typography rules, color codes (HEX, RGB, CMYK), logo spacing requirements, and UI kits accessible to every employee in real time.
Pillar 2: Centralized Digital Asset Management (DAM)
When marketing teams store final logos in local desktop folders, outdated or stretched graphic assets inevitably leak into public campaigns. Implement a single source of truth—such as a cloud-based DAM system—where approved media assets are categorized and updated instantly.
Pillar 3: Cross-Departmental Tone of Voice Frameworks
Your brand voice isn’t just for copywriters. Customer success agents, billing specialists, and frontline retail staff must be trained on your brand’s core tone metrics.
-
Example Matrix: Define whether your tone is Authoritative vs. Approachable, Witty vs. Formal, or Technical vs. Simple depending on the channel context.
Pillar 4: Systematic Omnichannel Auditing
Brand drift happens slowly over time as teams scale. Schedule structured, quarterly audits across your entire customer journey—from ad copy and landing pages to transactional receipts and customer support scripts—to catch and correct brand drift early.
Mapping Consistency Across the Customer Journey
To ensure complete alignment, track your brand’s visual and verbal presentation across every stage of the funnel:
| Funnel Stage | Primary Customer Touchpoints | Key Consistency Focus Areas |
| Awareness | Social Media Ads, SEO Content, Billboards | Visual identity, logo usage, primary value proposition |
| Consideration | Website, Product Demos, Sales One-Pagers | Tone of voice, product photography standards, typography |
| Conversion | Checkout Experience, Service Contracts | Pricing clarity, brand voice in legal/transactional copy |
| Post-Purchase | Packaging, Onboarding Emails, Support Tickets | Unboxing experience, empathetic customer service tone |
Step-by-Step Blueprint for Building Brand Alignment
If your organization suffers from fragmented branding, follow this four-phase implementation framework to restore order:
Phase 1: Conduct a Comprehensive Touchpoint Audit (Month 1)
-
Map Every Customer Interaction: Document every physical and digital touchpoint a customer encounters throughout their lifecycle.
-
Identify Discrepancies: Screenshot and collect physical samples of outdated logos, conflicting color palettes, and inconsistent messaging.
Phase 2: Build a Centralized Brand Hub (Month 2)
-
Migrate to Cloud Guidelines: Replace static PDFs with an interactive, web-based brand style guide.
-
Establish Asset Repositories: Upload high-resolution graphic assets, templates, and pre-approved copy snippets to a shared digital storage system.
Phase 3: Train Internal Teams and External Vendors (Month 3)
-
Host Cross-Functional Workshops: Train sales, customer service, product design, and HR departments on brand voice and asset usage.
-
Align External Partners: Distribute your brand hub links to freelance designers, agencies, and PR partners to enforce strict compliance.
Phase 4: Institute Governance and Feedback Loops (Ongoing)
-
Appoint Brand Guardians: Assign key leads in each department to review and approve public-facing creative assets before launch.
-
Review Quarterly Performance: Benchmark customer sentiment and brand perception metrics against historical baselines.
Expert Insights: Pro-Tips & Hidden Pitfalls
💡 Pro-Tip: The “Employer Branding” Alignment
Don’t forget that your internal team is your biggest brand channel. Align your internal job descriptions, onboarding materials, and internal communication with your external brand voice. When employees authentically embody your brand values internally, delivering an authentic experience to external customers becomes effortless.
⚠️ The “Rigid Uniformity” Trap
Consistency does not mean copying and pasting the exact same caption across every channel. Context matters! A corporate update on LinkedIn should adapt its format for TikTok while maintaining the underlying brand identity, values, and visual recognizability. Adapt the message to the platform without losing your core personality.
Turning Cohesion Into Competitive Advantage
Mastering brand consistency tips and building a unified touchpoint ecosystem is an ongoing operational commitment, not a one-off marketing campaign. When every advertisement, transactional email, unboxing moment, and customer support call reinforces the exact same core promise, you build an unbeatable moat of consumer trust.
In a crowded marketplace where options are endless, consistency is the ultimate shorthand for quality.
Now, I would love to hear from you: Which customer touchpoint in your current business stack is the hardest to keep aligned with your overall brand identity? Drop your thoughts or questions in the comments below, and let’s troubleshoot it together!
Best Team Communication Platforms for 2025: Cut Through the Noise

Source:https://cms-resources.prd.timeshighereducation.com
A few months ago, I was brought in to audit an enterprise marketing team that was bleeding productivity. Their project delivery times had slowed by nearly 40%, yet everyone complained of being utterly exhausted by the end of the workday.
When I looked under the hood, the root cause was painfully clear: the team was juggling five different messaging channels simultaneously. Important client updates were buried in Slack threads, internal approvals lived in Microsoft Teams chats, quick updates happened over WhatsApp, and strategic documentation was scattered across email.
The team wasn’t overworking; they were drowning in context switching.
In my ten years of building operational systems and advising high-growth organizations, I have seen this digital sprawl destroy team morale time and again. Choosing the right team communication platforms is no longer just an IT procurement task—it is a core business strategy that directly impacts your bottom line, employee retention, and output quality.
If you are looking to streamline your internal stack and select software that actually keeps your team connected without driving them crazy, here is your definitive blueprint.
The Central Train Station Analogy: Why Modern Stack Architecture Matters
Think of your company’s communication infrastructure like a major central train station. If every conductor builds their own track, arrives at random platforms without a timetable, and shouts directions over an intercom, total gridlock is inevitable.
+-------------------------------------------------------------+
|                     UNSTRUCTURED SPRAWL                     |
|  - Scattered chat channels & fragmented app stacks          |
|  - Constant notification pinging (High friction)             |
|  - Crucial project context lost in casual side-chats         |
+-------------------------------------------------------------+
                              ||
                              \/
+-------------------------------------------------------------+
|               INTEGRATED HUB ARCHITECTURE                   |
|  - Centralized messaging & structured channels              |
|  - Asynchronous workflows & notification hygiene            |
|  - Searchable knowledge repositories & automated routes     |
+-------------------------------------------------------------+
A well-architected communication system acts as a modern transit hub. It provides clear departure tracks for specific project types, structured timetables for asynchronous updates, and a single ticketing gate where all project data is safely archived and searchable.
Selecting software isn’t about buying the app with the most bells and whistles; it’s about building a clean, intuitive station where information moves seamlessly without crashing.
The Top Team Communication Platforms Evaluated
To help you choose the right tool for your specific operational scale, here is how the market leaders stack up across critical business parameters:
| Platform | Best Suited For | Standout Strength | Primary Limitation |
| Slack | Startups, Tech, & Creative Agencies | Unmatched app integration ecosystem & workflow automation | Can lead to notification fatigue if unmanaged |
| Microsoft Teams | Enterprises & Microsoft 365 Environments | Deep native integration with Office suite & enterprise security | Heavier UI; less intuitive for non-technical users |
| ClickUp | Project-Centric Teams | Seamlessly merges chat threads directly into task workflows | Steep learning curve during initial rollout |
| Basecamp | Asynchronous & Remote Teams | Calmer, message-board format that reduces real-time pressure | Lacks robust real-time video conferencing features |
4 Non-Negotiable Pillars of High-Performing Communication Software
Over a decade of testing software stacks with cross-functional teams has taught me that high-impact team communication platforms must deliver on four structural pillars:
                  +-----------------------------------+
                  | 1. Asynchronous Workflow Design   |
                  +-----------------------------------+
                                    |
                                    v
                  +-----------------------------------+
                  | 2. Deep Application Integration   |
                  +-----------------------------------+
                                    |
                                    v
                  +-----------------------------------+
                  | 3. Advanced Search & Knowledge Ops|
                  +-----------------------------------+
                                    |
                                    v
                  +-----------------------------------+
                  | 4. Enterprise Security Governance |
                  +-----------------------------------+
Pillar 1: Native Support for Asynchronous Workflows
Real-time chat encourages knee-jerk responses over thoughtful work. Top-tier tools offer structured threads, scheduled messaging, and voice/video memos that respect deep-work focus time across time zones.
Pillar 2: Deep Integration Ecosystems
Your communication hub shouldn’t operate as an island. It must seamlessly connect with your CRM, cloud storage, developer repositories, and project management boards (like Jira, Asana, or Salesforce) via robust APIs.
Pillar 3: Searchability and Context Retention
Information is useless if it gets buried under hundreds of daily messages. Platforms need powerful, filterable search features that turn daily conversations into a searchable corporate knowledge base.
Pillar 4: Enterprise Security and Compliance Standards
Protecting customer data is mandatory. Look for End-to-End Encryption (E2EE), Single Sign-On (SSO), multi-factor authentication, and compliance certifications like SOC 2 Type II, HIPAA, or GDPR compliance out of the box.
Step-by-Step Blueprint: Migration and Rollout Strategy
Switching platforms or consolidating a fragmented communication stack requires careful change management. Follow this tested, phased execution blueprint:
Phase 1: Audit and Need Mapping (Weeks 1–2)
-
Survey Your Team: Identify current communication bottlenecks, hidden shadow IT tools (like unauthorized messaging apps), and necessary app integrations.
-
Establish Channel Architecture: Define strict guidelines for what belongs in real-time chat versus email, project task comments, or long-form documents.
Phase 2: Pilot Testing and Governance Setup (Weeks 3–4)
-
Launch a Pilot Group: Test the chosen platform with a cross-functional group of 15–20 employees to surface friction points before a full rollout.
-
Set Notification Hygiene Rules: Draft explicit company policies regarding response time expectations, channel naming conventions, and quiet hours.
Phase 3: Organization-Wide Rollout (Weeks 5–6)
-
Execute Phased Onboarding: Host interactive, role-based training workshops rather than sending out passive PDF manuals.
-
Sunset Legacy Tools: Turn old platforms into read-only archives on a set deadline to prevent teams from falling back into old habits.
Phase 4: Optimization and Analytics Review (Ongoing)
-
Track Adoption Metrics: Monitor active usage, integration activity, and thread engagement to measure operational traction.
-
Refine Channel Sprawl: Periodically archive dead or redundant channels to keep workspace navigation clean and focused.
Expert Insights: Pro-Tips & Hidden Pitfalls
💡 Pro-Tip: The “Notification Protocol” Standard
The biggest productivity killer isn’t the software itself—it’s the expectation of instant responses. Set a firm company-wide rule: Real-time chat is for urgent blockers; asynchronous threads are for standard updates. Expecting responses within 2 to 4 hours rather than 2 to 4 minutes protects deep work and dramatically cuts burnout.
⚠️ Hidden Pitfall: The Unlimited Channel Explosion
Allowing any employee to create public channels without approval leads to digital clutter fast. Within six months, you will end up with dozens of abandoned channels, confusing duplicate threads, and fragmented information. Restrict channel creation permissions or run monthly channel audits to archive inactive rooms.
Final Thoughts: Intentional Communication Beats Flashy Software
At the end of the day, even the most advanced team communication platforms won’t solve underlying organizational friction on their own. Software is simply an amplifier of your existing operational culture.
By selecting a tool that aligns with your team’s core workflow, enforcing clear communication protocols, and prioritizing asynchronous clarity over constant connectivity, you transform your internal communications into a genuine competitive advantage.
Now I’d love to hear from you: What is the single biggest frustration your team faces with your current communication stack? Drop your thoughts or questions in the comments below, and let’s troubleshoot it together!
Planning an Annual General Meeting That Inspires: Beyond the Statutory Checklist
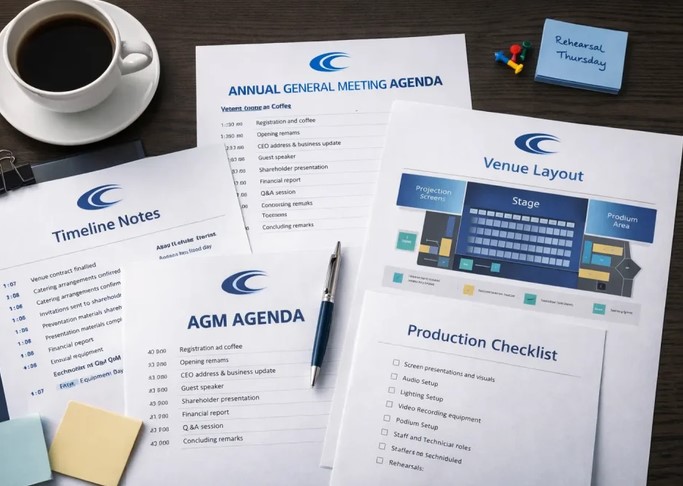
Source:https://futurespastevents.ca
A few years ago, I sat in the back of a brightly lit hotel ballroom attending a company’s Annual General Meeting. The executive team spent ninety minutes reading monochrome financial slides verbatim to a crowd of disengaged shareholders.
People were checking their phones, nodding off, or quietly calculating how soon they could leave without making a scene. What should have been a powerful stage to showcase strategic vision, celebrate wins, and align stakeholders had devolved into an expensive, compulsory compliance ritual.
In my ten-year career facilitating corporate transitions and advising executive boards, I have seen this exact dynamic play out dozens of times. Many organizations view annual general meeting planning purely as a legal burden imposed by corporate governance frameworks.
However, if you treat your AGM as merely a box-checking exercise, you waste one of the most valuable leadership platforms of the year. Here is how to transform your AGM from a dry statutory obligation into an event that builds shareholder trust, energizes investors, and reinforces corporate vision.
The Broadway Production Analogy: Why AGMs Need Scripting and Storytelling
Think of traditional annual general meeting planning like reciting a textbook aloud to an audience—technically informative, but fundamentally uninspiring.
A truly impactful AGM functions far more like a well-structured Broadway production. The corporate bylaws, voting procedures, and financial disclosures are simply the script that keeps you compliant.
+-------------------------------------------------------------+
|               TRADITIONAL "STATUTORY" AGM                   |
|  - Verbatim reading of financial disclosures               |
|  - Passive audience checking phones                        |
|  - Purely compliance-driven and backward-looking            |
+-------------------------------------------------------------+
                              ||
                              \/
+-------------------------------------------------------------+
|               INSPIRATIONAL "STRATEGIC" AGM                 |
|  - Narrative-driven strategic vision                        |
|  - Interactive, structured Q&A and active engagement        |
|  - Forward-looking value creation & trust building          |
+-------------------------------------------------------------+
Your job as an organizer or executive is to build a narrative arc around those facts: where the company stood a year ago, how it navigated industry headwinds, and where it is heading next.
When you frame compliance within a compelling story of resilience and strategic execution, compliance becomes the foundation for stakeholder alignment rather than a tedious chore.
4 Strategic Foundations of High-Impact AGM Planning
Before diving into logistics, your leadership team must anchor its strategy on four core operational pillars to ensure seamless execution and legal compliance.
                  +-----------------------------------+
                  | 1. Governance & Regulatory Rigor  |
                  +-----------------------------------+
                                    |
                                    v
                  +-----------------------------------+
                  | 2. Narrative Arc & Data Clarity   |
                  +-----------------------------------+
                                    |
                                    v
                  +-----------------------------------+
                  | 3. Seamless Tech Infrastructure   |
                  +-----------------------------------+
                                    |
                                    v
                  +-----------------------------------+
                  | 4. Transparent Q&A Mechanics      |
                  +-----------------------------------+
Pillar 1: Flawless Governance and Statutory Compliance
Inspiration cannot happen if your legal foundation fails. Ensure that notice periods, proxy voting rules, quorum requirements, and board resolution disclosures strictly comply with local corporate regulations and your company’s articles of association.
Pillar 2: Narrative Arc and High-Impact Data Visualization
Raw numbers rarely inspire action. Ditch dense spreadsheet screenshots and replace them with clear, high-contrast infographics that emphasize key financial metrics: EBITDA growth, customer retention rates, operational margin expansions, and total shareholder return (TSR).
Pillar 3: Reliable Technology Infrastructure
Whether hosting an in-person, virtual, or hybrid AGM, technical glitches undermine executive credibility. Invest in enterprise-grade webcasting, secure digital voting portals, and redundant network bandwidth.
Pillar 4: Transparent and Managed Stakeholder Engagement
Answering difficult questions builds far more trust than presenting perfect slides. Structure your Q&A segment to address challenging topics—such as market volatility or operational missteps—with complete executive candor.
Traditional vs. Modern AGM Planning: A Direct Comparison
Transitioning from a legacy compliance mindset to an inspirational format requires rethinking key event elements:
| AGM Element | Legacy Compliance Approach | Modern Inspirational Approach |
| Core Objective | Satisfy statutory obligations | Drive shareholder confidence and strategic alignment |
| Financial Delivery | Dense tables read aloud | Narrative-driven visual keynotes highlighting metrics |
| Q&A Structure | Unstructured, defensiveness-driven | Categorized, transparent, and constructively facilitated |
| Event Format | Monolithic physical meeting | Hybrid or digital-first with real-time proxy integration |
| Post-Event Impact | Meeting minutes archived in legal folders | Replay packages, executive highlights, and investor follow-ups |
Step-by-Step Blueprint: Executing an Inspiring AGM
To ensure both regulatory compliance and strong audience engagement, organize your annual general meeting planning across three distinct phases:
Phase 1: Pre-Event Strategy and Regulatory Setup (Weeks 1–6)
-
Draft Legal Notices and Proxy Materials: Draft the official Notice of Meeting, proxy forms, and annual reports alongside corporate counsel.
-
Audit Proxy Deadlines: Establish clear cut-off dates for proxy vote submissions and shareholder proposal registrations.
-
Develop the Narrative Blueprint: Conduct executive rehearsal sessions to align key presentations around a central strategic theme.
Phase 2: Technical Rehearsal and Platform Testing (Weeks 7–8)
-
Conduct Dry Runs: Perform full-scale technical rehearsals with board members, committee chairs, and technical crew to test slide transitions and microphone setups.
-
Test Digital Proxy Portals: Verify that electronic voting platforms correctly tally shareholder votes and validate voter identity securely.
-
Prepare Emergency Contingencies: Establish backup power sources, secondary internet connections, and fallback speaker plans for remote board members.
Phase 3: Live Execution and Post-Meeting Follow-Through (Event Day & Beyond)
-
Execute the Agenda with Precision: Maintain strict time discipline while ensuring all statutory agenda items—such as director elections and auditor appointments—are formally passed.
-
Host an Authentic Q&A Session: Group incoming questions by theme to cover diverse topics and address tough business challenges directly.
-
Publish Prompt Results: File official voting results with regulatory authorities immediately and distribute an executive video recap to shareholders who missed the live event.
Expert Insights: Pro-Tips & Hidden Pitfalls
💡 Pro-Tip: The “Pre-AGM Listening Tour”
Don’t wait for the live event to discover shareholder grievances. Conduct brief, informal listening calls with key institutional investors and major shareholders 30 days before the AGM. Understanding their primary concerns in advance allows you to address tough topics directly within your main presentation slides.
⚠️ Hidden Pitfall: The Filibuster Q&A Trap
Avoid letting an open microphone setup turn your Q&A into a platform for disgruntled individuals to air personal grievances unrelated to business performance. Set clear ground rules up front: limit questions to two minutes per shareholder and require questions to focus specifically on corporate strategy, governance, or financial performance.
Turning Mandatory Compliance into Strategic Momentum
Mastering annual general meeting planning isn’t about ignoring legal requirements—it is about elevating them. When you combine flawless corporate governance with clear data visualization, authentic leadership narrative, and structured stakeholder dialogue, your AGM ceases to be an expensive administrative routine.
Instead, it becomes an indispensable tool for reinforcing corporate integrity, rallying investor support, and setting a confident tone for the fiscal year ahead.
Now, I would love to hear from you: What is the most effective change your organization has made to make corporate shareholder meetings more engaging? Share your thoughts or questions in the comments below, and let’s keep the discussion going!
Discounts vs Added Value: Which Boosts Sales Better?

Source:https://cdn.prod.website-files.com
A SaaS client came to me a few years ago panicked about declining quarterly growth. To revive conversion rates, their marketing team slashed subscription prices by 30% across the board.
Sales numbers spiked over the next two weeks, and the leadership team celebrated. But six months later, the hangover hit.
Customer acquisition costs skyrocketed, churn tripled as price-sensitive customers jumped ship, and their profit margin dropped by nearly 40%. They had unwittingly trained their market to wait for the next price cut rather than value their core product.
In my ten years of building growth strategies and auditing sales pipelines, I have watched this scenario play out endlessly across e-commerce, B2B services, and retail. When revenue growth stalls, founders instinctively reach for the discounting lever.
However, comparing discounts vs added value strategies reveals a fundamental truth: slashing prices erodes profit margins and brand equity, whereas bundling premium incentives builds long-term customer lifetime value (LTV). Here is how to evaluate which strategy truly drives sustainable revenue growth for your business.
The Drug Addiction Analogy: Why Price Slashes Are Dangerous
Think of price discounting like taking an energy drink during an all-nighter. It provides an immediate, euphoric burst of performance, making your sales charts look incredible for a short weekend burst.
However, once the caffeine wears off, your system crashes. To recreate that same high next quarter, you have to drink two energy drinks—slashing your prices even deeper.
+-------------------------------------------------------------+
|                     THE DISCOUNTING SPIRAL                  |
|  - Immediate short-term sales surge                         |
|  - Reduced profit margins & degraded price integrity        |
|  - High churn from bargain-hunting customers                |
+-------------------------------------------------------------+
                              ||
                              \/
+-------------------------------------------------------------+
|                     THE ADDED-VALUE ENGINE                  |
|  - Unaltered price perception & premium positioning         |
|  - Enhanced perceived value via strategic bundling          |
|  - Sustainable margins & higher Customer Lifetime Value    |
+-------------------------------------------------------------+
When analyzing discounts vs added value, discounting operates on price subtraction, whereas added value operates on perceived multiplication.
Adding value—such as bonus onboarding, extended warranties, or exclusive software add-ons—enhances the offer’s perceived utility without destroying your underlying pricing architecture or profit margins.
Math That Kills: The Hidden Margin Trap of Discounting
Many early-stage founders mistakenly treat a 20% price discount as a simple 20% hit to top-line growth. In reality, discounting eats directly out of your gross margin.
Let’s break down the math using a basic product unit cost structure:
| Financial Metric | Standard Price Offer | 20% Discounted Offer | Impact Breakdown |
| Retail Selling Price | $100 | $80 | -20% Price Reduction |
| Cost of Goods Sold (COGS) | $60 | $60 | Fixed Operating Cost |
| Gross Margin Dollar | $40 | $20 | -50% Profit Collapse |
| Gross Margin Percentage | 40% | 25% | Massively Reduced Profitability |
The Math Lesson: To make the same overall profit dollars on a 20% price slash, you have to sell 100% more units just to break even! Conversely, if you offer an added-value bonus that costs you $5 to fulfill but carries a $40 perceived market value, your gross profit remains virtually untouched while increasing conversion friction.
The Behavioral Economics of Customer Perception
Choosing between discounts vs added value is ultimately a battle for consumer psychology. How human brains evaluate cost and value dictates your long-term brand equity:
1. Anchor Pricing and Price Integrity
When you discount repeatedly, your customer’s reference price permanently drops. If a $200 course goes on sale for $99 every minor holiday, consumers accept $99 as its true worth. Charging $200 again feels like an unfair price hike.
2. High-Value Customer Acquisition vs. Bargain Hunters
Price cuts attract transactional buyers who possess low loyalty and high support costs. Added-value promotions attract quality-conscious consumers looking for the best overall experience, resulting in superior retention rates.
3. The Power of Free vs. Fractional Discounts
Behavioral economist Dan Ariely famously demonstrated the “Zero Price Effect.” Consumers perceive disproportionately high value in receiving something completely FREE (e.g., “Buy a suit, get a free tailor adjustment and silk tie”) compared to receiving a fractional percentage off (e.g., “Take 15% off your suit purchase”).
4 Strategic Frameworks to Add Real Value Without Spreading Overhead
If you want to move away from destructive margin slashing, implement these four value-add strategies:
                  +-----------------------------------+
                  | 1. Premium Product Bundling       |
                  +-----------------------------------+
                                    |
                                    v
                  +-----------------------------------+
                  | 2. VIP Access & Extended Support  |
                  +-----------------------------------+
                                    |
                                    v
                  +-----------------------------------+
                  | 3. Complementary Educational Assets|
                  +-----------------------------------+
                                    |
                                    v
                  +-----------------------------------+
                  | 4. Risk Reversal Guarantees       |
                  +-----------------------------------+
Framework 1: High-Margin, Low-COGS Bundling
Pair your primary offering with digital resources, software accessories, or physical add-ons that cost you pennies to produce but carry immense functional utility for the end user.
Framework 2: Expedited Delivery and Priority Onboarding
For service businesses and B2B SaaS, offer priority queue access, fast-tracked implementation, or quarterly strategy reviews instead of cutting contract rates.
Framework 3: Educational and Implementation Assets
Help customers achieve their end goal faster. Throw in exclusive video masterclasses, template libraries, or implementation checklists that increase product adoption and reduce early churn.
Framework 4: Ironclad Risk Reversal
Instead of lowering prices to ease consumer hesitation, double down on risk mitigation. Offer extended money-back guarantees, free trial periods, or performance-based satisfaction clauses.
Step-by-Step Transition Plan: Phasing Out Discounts
If your customer base is already accustomed to frequent promotional sales, switching cold turkey can cause short-term friction. Use this four-step sequence to migrate gracefully toward value-add offers:
Phase 1: Audit Historical Promotion Performance (Month 1)
Review your past promotional campaigns. Calculate the exact customer acquisition cost (CAC), churn rate, and net profit margin for discounted customers versus full-price buyers.
Phase 2: Develop High-Perceived-Value Incentives (Month 2)
Create or license complementary digital assets, white-glove onboarding packages, or physical accessories. Ensure your fulfillment cost remains below 10% of the core product price.
Phase 3: Test “Gift with Purchase” Campaigns (Month 3)
Run a split test (A/B test) during your next promotional cycle. Target Segment A with a 15% discount code and Segment B with a high-value “Gift with Purchase” bundle at full price.
Phase 4: Establish Permanent Price Integrity (Month 4)
Eliminate blanket sales calendars. Reserve rare price adjustments solely for annual contract commitments or clear inventory clearances, anchoring all routine marketing around added-value incentives.
Expert Insights: Pro-Tips & Hidden Pitfalls
💡 Pro-Tip: The B2B “Trade-Off” Negotiation Rule
In high-ticket sales, never grant a discount without taking something away in return. If an enterprise client demands a 15% price reduction, agree ONLY if they sign a longer 2-year contract, pay the full balance upfront, or remove premium SLA support. This protects your perceived value and maintains leverage.
⚠️ Hidden Pitfall: The Irrelevant Incentive Flop
Adding value only works if the bonus directly solves an immediate secondary problem for your customer. Bundling a useless, low-quality freebie with your core product cheapens the offer and lowers conversion rates faster than offering no bonus at all.
Final Verdict: Building Sustainable Growth
When weighing discounts vs added value, remember that price cuts protect your present sales volume at the expense of your future profit margins. Added-value strategies, on the other hand, build long-term enterprise value, protect brand prestige, and cultivate loyal customers who buy based on outcomes rather than bargain basement tags.
Reserve discounting strictly for strategic clear-outs or annual upfront payments—and make value addition the centerpiece of your routine growth strategy.
Now, I would love to hear from you: What is the most successful value-add incentive you have ever used to close a deal without slashing your price? Drop your thoughts in the comments below, and let’s keep the discussion going!
Setting Franchise ROI Expectations for Investors: A Realistic Guide

Source:https://assets.seobotai.com
A client walked into my office a few years back, beaming with excitement after reading a franchise marketing brochure. The glossy booklet touted “rapid expansion” and implied a full payback on a $500,000 investment within eighteen months.
I had to be the bearer of bad news. When we dug into the actual Item 19 financial disclosures, adjusted for working capital, and built a proper cash flow model, the realistic timeline to break even was closer to four years. The look of disappointment on his face was a classic case of misaligned expectations.
In my decade of evaluating franchise deals and advising investors, I have seen this scenario play out time and again. Many prospective business owners treat franchises like high-yield savings accounts with turnkey convenience.
In reality, setting ground-level franchise ROI expectations requires navigating Item 19 disclosures, hidden operational overhead, and ramping periods. Here is how to evaluate prospective franchise yields with cold, hard numbers—and zero fluff.
Why Setting Realistic Franchise ROI Expectations Is So Hard
Evaluating a franchise investment isn’t like buying a stock where you can look up a ticker’s historic P/E ratio on your phone. Franchise earnings representations are notoriously tricky to interpret if you do not know where the traps are hidden.
Think of buying a franchise like purchasing a high-performance sports car. The franchisor provides the chassis, the engine, and the blueprint. However, you still have to buy the fuel, pay for maintenance, and drive the car through traffic.
If you assume the car will constantly run at its advertised top speed on a clear highway, you will run out of gas long before reaching your financial destination.
+-------------------------------------------------------------+
|               GLOSSY BROCHURE PROPOSITIONS                  |
|  - Top-line revenue numbers highlighted                     |
|  - Best-performing 10% units used as benchmarks             |
|  - Operational ramp-up periods ignored                      |
+-------------------------------------------------------------+
                              ||
                              \/
+-------------------------------------------------------------+
|               REAL-WORLD GROUND TRUTH                       |
|  - Net profit margin after royalty & marketing fees         |
|  - 12-24 months of negative cash flow (Ramp-up)            |
|  - Working capital, debt service, & local market dynamics   |
+-------------------------------------------------------------+
Decoding Item 19: Separating Fact from Marketing Spin
To establish accurate franchise ROI expectations, your first stop is the Franchise Disclosure Document (FDD), specifically Item 19 (Financial Performance Representations).
While Item 19 is invaluable, franchisors are not legally required to provide one. Furthermore, those who do often present data in ways that highlight their top performers while obscuring average or below-average units.
1. The “Averages” Trap
Franchisors frequently present average gross sales rather than median net income. A single top 5% flagship location in a bustling metropolitan hub can artificially distort the average revenue of the entire network. Always ask for median numbers broken down by performance quartiles.
2. Gross Sales vs. Net Owner’s Discretionary Earnings
Gross sales figures look impressive on paper, but they ignore the heavy operational deductions that hit your bottom line. Royalty fees (typically 4% to 8%), national advertising contributions (1% to 3%), commercial rent, labor, and local supply chain costs rapidly trim those margins.
3. Mature Units vs. Ramp-Up Units
Item 19 figures usually highlight units open for more than 24 or 36 months. They rarely account for the initial cash bleed during year one when your location is building local brand recognition.
The Realistic ROI Benchmark Across Major Sectors
While every brand varies, years of deal auditing reveal distinct financial patterns across popular franchise categories.
| Sector | Average Initial Capital | Typical Net Margins | Real Payback Period |
| Quick-Service Restaurants (QSR) | $350,000 – $2,500,000+ | 10% – 18% | 3 – 5 Years |
| Fitness & Wellness Studios | $200,000 – $600,000 | 15% – 25% | 2.5 – 4 Years |
| Home Services (Mobile) | $75,000 – $200,000 | 20% – 35% | 1.5 – 3 Years |
| Business-to-Business (B2B) | $150,000 – $400,000 | 18% – 30% | 2 – 3.5 Years |
Key Rule of Thumb: A healthy franchise unit typically yields an annualized Return on Investment (ROI) of 15% to 25% after paying the owner a fair market salary for their operational role. If a brand promises 50%+ annual returns without high risk or specialized skill requirements, inspect their figures closely.
4 Critical Variables That Dilute Your Real Franchise Yields
To build an accurate cash flow forecast, factor in these four commonly overlooked expenses before calculating your projected internal rate of return (IRR):
                  +-----------------------------------+
                  | 1. Debt Service & Financing Costs |
                  +-----------------------------------+
                                    |
                                    v
                  +-----------------------------------+
                  | 2. Working Capital Reserves       |
                  +-----------------------------------+
                                    |
                                    v
                  +-----------------------------------+
                  | 3. Local Labor Cost Variations    |
                  +-----------------------------------+
                                    |
                                    v
                  +-----------------------------------+
                  | 4. Technology & System CapEx      |
                  +-----------------------------------+
1. Debt Service and SBA Loan Terms
If you finance 70% of your buildout via an SBA 7(a) loan, debt service will consume a significant portion of your monthly operational cash flow. Calculate your ROI based on unlevered vs. levered cash yields to see how interest rate fluctuations impact your net distribution.
2. Underfunded Working Capital
Most franchisors list required working capital in Item 7 for 3 to 6 months. In practice, local permitting delays, hiring challenges, and slower initial customer adoption mean you should plan for 9 to 12 months of runway.
3. Labor and Minimum Wage Spikes
Labor is often the single largest variable expense for retail and restaurant concepts. Local minimum wage increases, payroll taxes, and employee turnover can easily shave 3% to 5% off your net margins if not modeled correctly.
4. Mandatory Capital Expenditures (CapEx)
Franchise agreements usually last 10 years and contain “refresh” clauses. At the 5-year mark, you may be required to upgrade store signage, point-of-sale systems, or interior decor—costing anywhere from $20,000 to over $100,000 out of pocket.
Step-by-Step Framework for Conducting Due Diligence
When evaluating potential investments, follow this battle-tested validation process:
Expert Insights: Pro-Tips & Hidden Pitfalls
💡 Pro-Tip: The “Owner-Operator vs. Semi-Absentee” Yield Adjustment
If you plan to hire a general manager so you can remain semi-absentee, subtract $50,000 to $80,000 annually from your projected net income. Many Item 19 figures assume an owner-operator who works 50+ hours a week without taking a manager’s salary out of overhead.
⚠️ The Local Supply Chain Markup
Some franchisors make a substantial portion of their profit by marking up required inventory, ingredients, or equipment sold directly to franchisees. Always ask existing owners if franchisor-mandated vendors offer competitive market prices or if supply chain markups compress margins.
Final Thoughts: Grounding Your Expectations
Achieving financial independence through franchising is a proven path, but it requires cold analytical rigor rather than optimistic guesswork. When setting your franchise ROI expectations, remember that stability, brand recognition, and a proven playbook are what you are buying—not guaranteed instant wealth.
Calculate your numbers conservatively, run thorough franchisee validation calls, and ensure your capital reserves can weather unexpected ramp-up delays.
Now, I would love to hear from you: If you are currently evaluating a franchise opportunity, what is the biggest uncertainty in your financial modeling right now? Drop your questions in the comments below, and let’s break down the numbers together!